Bollinger Bands® - A Volatiltiy Meter
Bollinger Bands are technical indicator developed around 1980s by John A. Bollinger.
He was an option trader then. As an option trader he delved into volatility, a measure for variation of price of a financial instrument over time.
He came up with ingenious idea to measure volatility by making use of simple moving average and placing a certain number of standard deviation above and below the simple moving average (SMA).
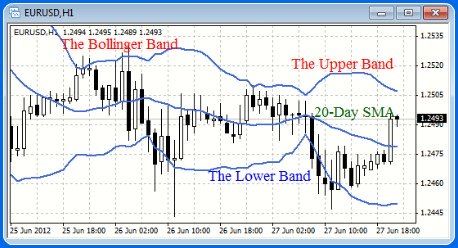
 The Bollinger Bands
Standard Deviation
The standard deviation is a statistics concept. It measures how spread out a set of data is from the average (mean or expected value).
A low standard deviation number informs that the data points tend to be clustered close to the average.
The high standard deviation number on the other hand informs that the data points are spread out over a large range of values.
So How Does Standard Deviation Measure Volatiltiy?
John Bollinger used standard deviation to determine the range of price fluctuations relative to the 20-day simple moving average.
So if the prices are spread out, it means that the market is more volatile. The bands expand on high volatility.
On the other hand, if the prices are closed to the 20-day simple moving average then it means the market is less volaitile. The band contracts on low volatility.
These high and low volatility can be plotted in charts which essentially forms the upper band and the lower band in the Bollinger Bands indicator.
Bollinger Bands Calculation
The Bollinger Bands consists of three lines.
The middle line is the 20-Day Simple Moving Average (SMA), the Upper Band (UB) and the Lower Band (LB).
20-Day SMA = [Sum of the 20-Day Close Price / Period Used (N) ]
Upper Band (UB) = SMA + (D * StdDev)
Lower Band (LB) = SMA - (D * StdDev)
where,
N is the number of periods used which in this case is 20
D = 2 is the number of standard deviation away from the 20-Day SMA
StdDev is the Standard Deviation
StdDev = SQRT ([SUM{CLOSE- SMA(CLOSE, N)}^2, N] / N)
Mr. Bollinger suggests using 20-Day for SMA calculation.
Also the Upper Band and Lower Band are each plotted 2 standard deviations away from 20-Day SMA.
Application of Bollinger Band in Trading
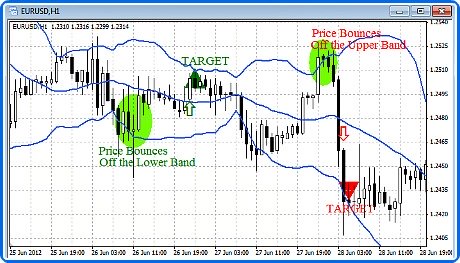
As a rule of thumb, prices are considered overbought when they touch the upper band. And they are considered oversold when they touch the lower band.
So these upper bands and lower bands can be considered as the price targets.
When the prices bounce off the lower band and crosses above the 20-day SMA, a buy signal could be generated with an upside target reaching the upper band limit.
Similarly, when the prices dip from the upper band and crosses below the 20-day SMA, a sell signal could be generated with a downside target reaching the lower band limit.
 Bollinger Bands Trading Application
Bollinger Bands could also warn of early reversals.
When the two bands are spread out unusually far apart, or when the two band are too narrowed it potentially suggests that a new trend is developing.
If prices break through the upper band then a continuation of the current trend is to be expected.
-
Return to
- Technical Analysis
- Bollinger Bands
- Home


Have your say about what you just read! Leave me a comment in the box below.