Amazing Moving Average
The moving average is a widely used trend following indicator.
It can be easily evaluated and tested and thus it is considered as the foundation for many trend following forex trading robots.
However, as a trend following indicator, it lags the market action.
It keeps track of trend once it progresses but it will not predict trend reveresal.
In contrast, candlestick analysis could come handy in market forecasting purpose.
THREE TYPES OF AVERAGES
There are three following types of averages commonly used in technical analysis:
THE SIMPLE MOVING AVERAGE (SMA)
In mathematics, the average also known as the simple moving average or the arithmetic mean or simply mean measures the central tendency of a set of data.
Mathematically, average (A) = sum of the numbers / size of the collection
The Simple Moving Average Calculation
For example: Consider calculating moving averages of 7 days. Since closing prices are the most preferred data in technical analysis, we will stick with closing prices.
Consider daily closing prices: 8, 9, 10, 11, 12, 13, 14, 15, 16
First day of 7-day Moving average
= (sum of the numbers / size of the collection)
= (8+9+10+11+12+13+14) / 7
= 11
Second day of 7-day Moving average
= (sum of the numbers / size of the collection)
= (9+10+11+12+13+14+15) / 7
= 12
Third day of 7-day Moving average
= (sum of the numbers / size of the collection)
= (10+11+12+13+14+15+16) / 7
= 13
In the first example, we simply calculate average of first seven set of data and divide by 7 to arrive at 11 as the first day 7-day average.
When calculating successive values, a new value comes into the sum and an old value drops out.
As the closing price becomes available on next day, we compute second day average in the same way as we computed the first day average but we drop the first day data 8 and added new data 15.
Similarly, on the third day, we drop 9 and add 16 to arrive at the third day 7-day average as 12.
So in this example, as the price progresses with time, so does averages. Daily closing prices in our above example moved from 8 to 16. Likewise averages moved from 11 to 13.
Hence this average is named moving averages as it moves along with price movement.
Also notice, that averages is always less than the last closing price of that day.
The first day 7-day average 11 is less than the last closing price 14.
Similalry, second day 7-day average and thrid day 7-day averages 12 and 13 are less than the last closing price of 15 and 16 respectively.
Thus moving average is called lagging trend following indicator.
The simple moving average, though simple to implement to track progress of market trend is often criticized for following reasons:
- The only periods covered by SMA is taken into consideration.
For example, in the 7-day moving average, only the periods of seven day is considered. So many believes that the SMA misses significant past information beyond seven day which otherwise should have been taken into consideration as well. - The SMA assigns equal weight to each periods covered.
For example, in the case of 7-day moving average, each seven day's close price recieve same weight. Though each day's close price is significant in order to calculate 7-day SMA, many also think that the recent close price should bear more weight than the past data. In other words, the close price on day one should bear less weight and the day seven close price should bear more weight as recent data is more significant.
THE WEIGHTED MOVING AVERAGE (WMA)
Also known as the linearly weighted moving average or simply WMA addresses one of the criticism of the simple moving average (SMA). It introduces multiplying factors to assign different weights to data at different positions during the sample window.
In the calculation of 7-day WMA, the first day close price is multiplied by 1, the second day by 2 and so on... to the seventh day close price multiplied by 7. Then the sum of it is divided by the multiplier =(1+2+3+4+5+6+7) to arrive at WMA value.
In this process, the first day close price gets less weight whereas the last seventh day or the recent close price gets greater weight.
The Weighted Moving Average Calculation
For example: Consider calculating the 7-day linearly weighted moving averages and compare with the 7-day simple moving averages.
Consider daily closing prices: 8, 9, 10, 11, 12, 13, 14
7-day Linearly Weighted Moving Average (WMA)
= ( 8x1 + 9x2 + 10x3 + 11x4 + 12x5 + 13x6 + 14x7 ) / (1+2+3+4+5+6+7)
= (336 / 28)
= 12
7-day Simple Moving average (SMA)
= (sum of the numbers / size of the collection)
= (8+9+10+11+12+13+14) / 7
= 11
So the WMA is greater than SMA for the same period in above example. Hence, WMA reduces the lag in the SMA by applying more weight to the recent close prices.
However the linearly weighted moving average (WMA) still does not address concern regarding the criticism that the only periods covered by WMA itself is taken into consideration.
THE EXPONENTIAL MOVING AVERAGE (EMA)
Also known as the exponentially smoothed moving average, exponentially weighted moving average or simply EMA, addresses both of the criticism of the simple moving average.
It includes all the data in the life span of the instrument being examined. It also assigns greater weight to the more recent data.
Mathematically,
EMA_today = EMA_yesterday + α X (Price_today - EMA_yesterday)
where,
Price_today is the close price of the day and
α is the smoothing factor.
Also, α = 2/(N+1)
where N = Number of periods.
For the first calculation of EMA, the simple moving average is used instead of EMA_yesterday since the EMA has to have a starting point.
The Exponential Moving Average Calculation
For example: Consider calculating exponential moving averages of 7 days. Consider daily closing prices: 8, 9, 10, 11, 12, 13, 14
We need three pieces of information in order to calculate EMA.
First, let's calculate 7-day SMA since we will need to use it in place of EMA_yesterday for the first calculation of EMA.
First day of 7-day Moving average
= (sum of the numbers / size of the collection)
= (8+9+10+11+12+13+14) / 7
= 11
Second, let's calculate α where,
α = 2 / (N+1) where N = Number of periods
= 2 / (7+1) where N = 7 since periods is 7
= 2/8
= 0.25
= 25%
This implies that for a 7-day period EMA applies a 25% weighting to the most recent price.
EMA_today = EMA_yesterday + α X (Price_today - EMA_yesterday)
= 11 + 0.25 X (14 - 11)
= 11 + 0.25 X 3
= 11+ 0.75
= 11.75
APPLICATION OF MOVING AVERAGES
In our day to day trading life, implementing moving averages on chart or candlestick analysis is just as easy as a click of button. Thanks to revolution in forex trading systems more and more technical indicators are available to just any traders at any level.
The moving averages could be applied to generate buy and sell signal. I will mostly discuss signal generation using moving averages in conjunction with candlestick chart.
The Use of A Single Moving Average
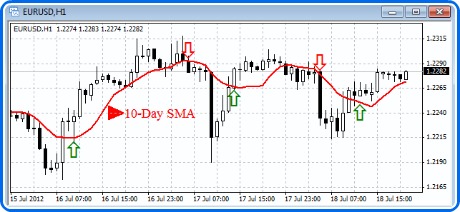
Using the simple moving average a buy signal is generated when the bullish full bodied candlestick close above the SMA line.
A sell signal is generated when the bearish full bodied candlestick close below the SMA line.
 Single Moving Average Application
Applying a single moving average to generate signal has its own limitations. It needs fine tunning at the mercy of expert traders to generate consistent and profitable signal.
For example, a shorter period averages like 5 or 10-day SMA generates more signals as they are more sensitive to price fluctuation. They often generate more noise or premature signals as well.
On the other hand, a longer period averages like 50 or 100-day SMA generates less signals and are more reliable when trend is intact. They do a good job in filtering out noise, however, are worthless during trend reveresals.
The Double Crossover Method
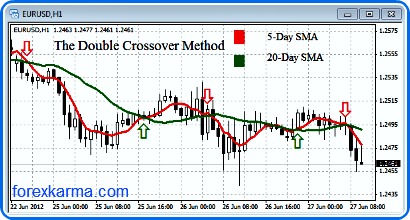
The double crossover method apply two moving averages to generate a signal.
 The Double Crossover Method
In this process a shorter and longer averages are combined to get a result that is sensitive enough to produce early signals whereas insensitive enough to avoid random noise in the market.
Some of the most popular combinations are 5-day and 20-day averages and 10-day and 50-day averages.
For example, using 5-day and 20-day averages, a buy signal is generated when 5-day SMA crosses above the 20-day SMA. A sell signal is generated when 5-day averages crosess below the 20-day SMA.
The Triple Crossover Method
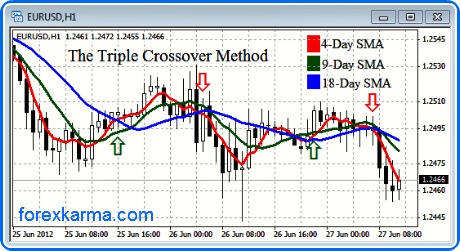
The triple crossover method apply three moving averages to generate a signal.
 The Triple Crossover Method
The widely popular combination is a 4-9-18 moving averages combination. The other popular combination is a 5-10-20 moving averages combination.
In applying three moving averages in combination, the shortest period is the most sensitive and follows the trend very closely.
For example, in applying 4-9-18 day moving averages, the 4-day will follow the trend closely followed by 9-day and 18-day.
So the proper alignment in any case to generate a valid signal would be 4-day SMA followed by 9-day and 18-day SMA.
In a downtrend, a buy signal is generated when the 4-day SMA crosses above the 9-day SMA, which is above the 18-day SMA.
In an uptrend, a sell signal is generated when the 4-day SMA crosses below the 9-day SMA, which is below the 18-day SMA.
-
Return to
- Moving Average
- Home


Have your say about what you just read! Leave me a comment in the box below.